使用 gperf 工具查看内存和 CPU 使用情况,先以分析内存为例介绍整个流程。
内存
安装
1
2
| yum install google-perftools
yum install graphviz ghostscript
|
运行
1
2
3
4
5
6
7
8
9
10
11
12
13
14
|
export LD_PRELOAD=libtcmalloc.so
export HEAPPROFILESIGNAL=12
export HEAPPROFILE=test.prof
export HEAP_PROFILE_ALLOCATION_INTERVAL=0
export HEAP_PROFILE_DEALLOCATION_INTERVAL=0
export HEAP_PROFILE_INUSE_INTERVAL=0
export HEAP_PROFILE_TIME_INTERVAL=0
./main
kill -12 `pidof $binary_name`
|
数据分析
1
2
3
4
5
6
7
8
9
10
|
pprof main test.prof.0001.heap --pdf > res.pdf
pprof main test.prof.0001.heap --text > res.txt
pprof main test.prof.0001.heap --base=test.prof.0000.heap --pdf > res.pdf
pprof main test.prof.0001.heap --base=test_log.0000.heap
pprof main test.prof.0001.heap --base=test_log.0000.heap --inuse_objects
|
文本形式的列含义:
1
2
3
4
5
6
7
| % pprof ./main ./test.log.0001.heap --text
255.6 24.7% 24.7% 255.6 24.7% GFS_MasterChunk::AddServer
184.6 17.8% 42.5% 298.8 28.8% GFS_MasterChunkTable::Create
176.2 17.0% 59.5% 729.9 70.5% GFS_MasterChunkTable::UpdateState
169.8 16.4% 75.9% 169.8 16.4% PendingClone::PendingClone
76.3 7.4% 83.3% 76.3 7.4% __default_alloc_template::_S_chunk_alloc
49.5 4.8% 88.0% 49.5 4.8% hashtable::resize
|
- 第一列:以 MB 为单位的内存分配情况
- 第四列:所有的进程和它调用函数的内存之和
- 第三列:第二列累加之和,如:第二行的第三列就是第一行的第二列加第二行的第二列
- 第二、第五列:第一列和第四列的百分比表示
CPU
使用
CPU 使用的分析和内存非常接近,区别在于使用的动态库和环境变量。
1
2
3
4
|
export LD_PRELOAD=./libprofiler.so
export CPUPROFILESIGNAL=12
export CPUPROFILE=test.prof
|
1
| pprof main test.prof.0 --pdf > res.pdf
|
还有一点不同之处:在分析内存时,发送信号会 dump 当前的内存使用情况;在分析 CPU 使用时,需要发送两次信号才会 dump,dump 出的信息是两次发送信号之间的时间段的 CPU 使用情况。
数据分析

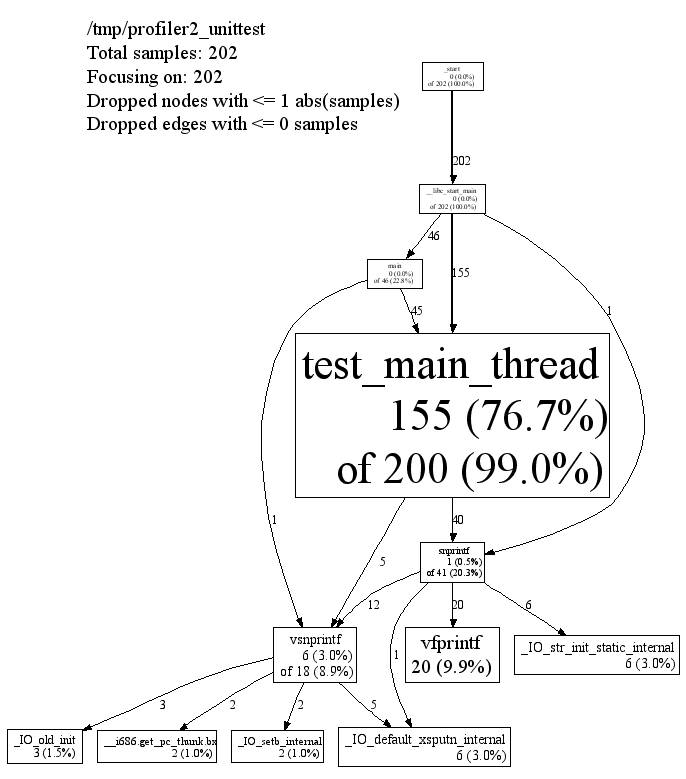
以这张图为例,每个结点分为四个部分:
- 类名
- 函数名
- 采样次数(百分比)
- 整体采样次数(百分比)
比如说,上图中的 test_main_thread 函数,共采样到 200 次,其中 155 次是在执行该函数,其他 45 次是在执行其调用的其他函数。
参考
Google CPU Profiler 学习小结
